


KubeStory #003: Scale your application with the v2 of HorizontalPodAutoscaler
This story is about scaling your pods with new tools


After reading multiple fantastic articles on the release of Kubernetes 1.23, a customer reached out to me last week to talk about the GA of HorizontalPodAutoscaler (HPA) v2. As you know, I won't miss a chance to share a great KubeStory with you, and this is an excellent opportunity to deep dive into some fresh features.
HPA v2 has been on its way since 2016, so the features described in this story are not, properly speaking, new. However, the mentioned features are now out of beta and entered the GA feature set.
HorizontalPodAutoscaler controls the scale of a Deployment and its ReplicaSet
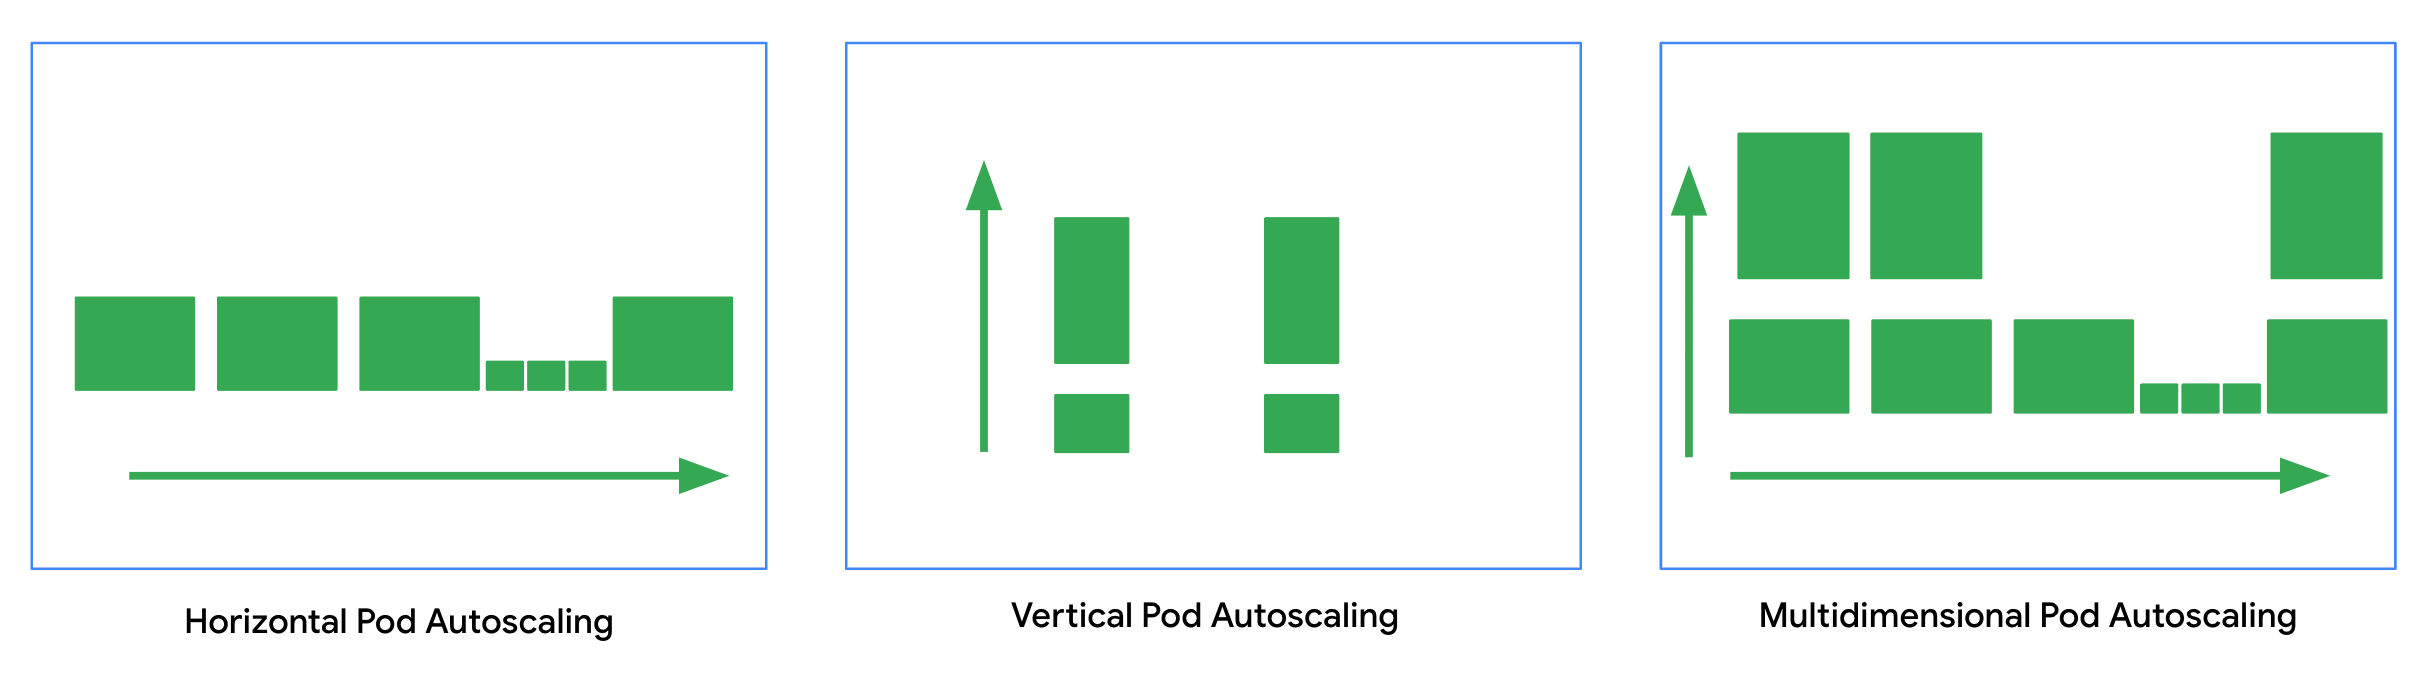
Scalability is one of the main Kubernetes adoption drivers. On Kubernetes, you can scale your workloads on multiple dimensions, and the horizontal scaling of pods is one of them.
The purpose of HPA is to periodically increase and decrease the number of Pod replicas count based on metrics.
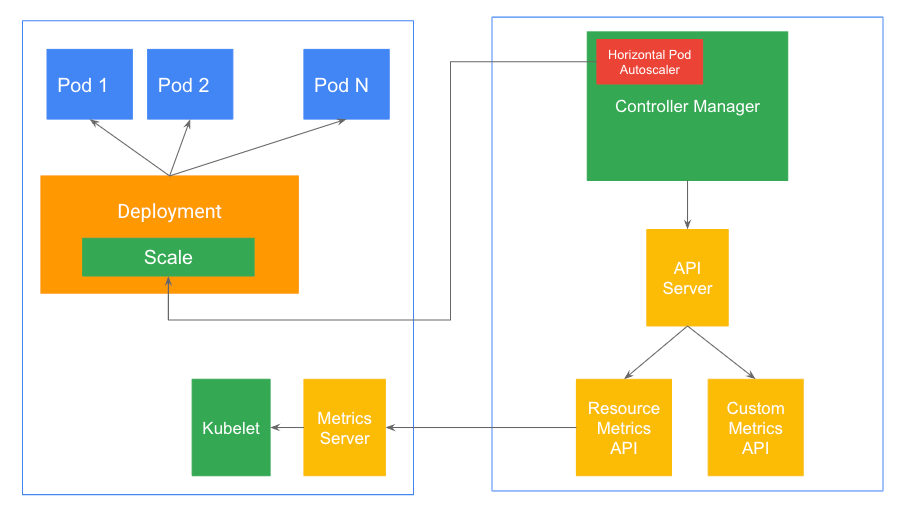
Kubernetes implements HPA as a control loop. Therefore, if you have numerous scale targets, you will have multiple HPA loops in the ControllerManager.
The ControllerManager regularly (at a fixed interval) queries the metrics specified in the HPA definition from either the resource metrics API or the custom metrics API (via the Aggregation Layer).
Metrics Server collects metrics from the Summary API, exposed by Kubelet on each node, and is registered with the main API server via Kubernetes aggregator. This is part of the Kubernetes Resource metrics pipeline.
Note: Pre-1.23, these resources have been primarily gathered from cAdvisor (Kubelet). However, in 1.23, with the introduction of the PodAndContainerStatsFromCRI FeatureGate, container and pod level stats can be collected by the CRI implementation.
An Algorithm, executed by the ControllerManager, then uses these metrics to compare desiring and current state. Finally, HPA applies the required adaptation to the number of replicas via the Scale subresource.
The Algorithm section contains most of the auto-scaling logic, so I highly encourage you to read this.
Multiple new tools are now GA.
The support for HPA has been growing fast since 2015, HPA being a prominent part of Kubernetes for most users.
With 1.23, multiple features are now stable, and some companies will adopt them.
Scaling on custom metrics
Using the metrics server, you can use HPA to scale your replicas based on CPU and Memory consumption. However, if you need to use other metrics, like request per second or even packet per second, or if you want to use an average value instead of an average utilization, then you need access to custom metrics.
If your cluster validates the pre-requisites, you can use HPA with numerous sources from the metrics aggregated APIs. This aggregation layer allows the ControllerManager to query from:
metrics.k8s.io -> Metric Server
custom.metrics.k8s.io -> Adapter
external.metrics.k8s.io -> Adapter
To configure HPA with custom metrics, you will need an Adapter. The adapter choice will depend on your needs in terms of metrics storage (where do you want to store the metrics) and exposure (what metrics do you need).
One example is the k8s StackDriver adapter. This adapter implements the Custom and External metrics API using Google Cloud Stackdriver/Operation as a backend. This component aims to expose metrics from Stackdriver to the API Server.
You can find an example of HPA with custom metrics implementation in the Kubernetes documentation.
I have seen good and bad regarding custom metrics, one of the major issues being the usage of custom metrics (mostly request per second) to get around the lack of control on CPU and Memory.
Regarding external metrics, they are some interesting usage. For example, this mentioned customer has long-running jobs pulling from Pub/Sub. He uses external metrics to get the depth of his Pub/Sub queue and scale the number of workloads accordingly.
Scaling on multiple metrics
When you get familiar with custom and external metrics, you may encounter one problem: How do you scale on Pub/Sub queue depth and Memory?
The purpose of multiple metrics is to make this available to your toolbox.
There is an example in the walkthrough section. The main difference is the usage of multiple metric blocks.
The only thing to remember is that HPA will evaluate all the metrics blocks in the reading order and then apply the maximum required replicas count if it doesn’t exceed your defined max value.
Configurable scaling behavior
If you have been exposed to HPA long enough, you may have experienced flapping. Flapping happens when the number of replicas isn't stable enough (due to fast change on the metrics) and requires consistent updates between the refresh interval of the ControllerManager.
Scaling behavior offered the possibility to apply scaling policies for both scales up and scales down. In addition, this defined behavior will override the default value of your HPA to provide more control.
There are two potent tools available in the scaling policies.
The first one is the policy itself. It allows you to define the maximum changes in the number of replicas that can happen in a specified period.
For example, only scale down two pods maximum in a period of 15 seconds.
The second is the stabilization window. It is your most vital tool against flapping. When the metrics indicate that the HPA should downscale the target, the algorithm looks into previously computed desired states and uses the highest value from the specified interval. Using an interval can dilute the impact of quick changes in metrics and avoid the flapping effect.
In this story, the customer chooses to use an admission webhook to enforce the presence of a behavior field on any job workload. It may sound brutal, but it implements developers' relations with the platform.
Learn by using the tool.
After reading this story, the best thing you can do is share it and play with the tool!
One of the best skills of an ideal platform engineer is to know when to use a tool. And the only way to improve this skill is to experiment.